Article · Housing market
US Home Sales Just Hit Their Lowest Level Since 2010, and the Full Data Is Worse Than the Headline
NAR's October report put existing-home sales at the lowest pace since 2010. The regional breakdown, the affordability index, and the 2005 comparison tell a sharper story than the single headline number.

- 3.75MExisting-home sales, October 2026 (seasonally adjusted annual rate)
- -8.8%Year-over-year decline in sales
- 7.4%+Mortgage rate peak that triggered the mid-October pullback
- 2010Last time the sales pace was this low
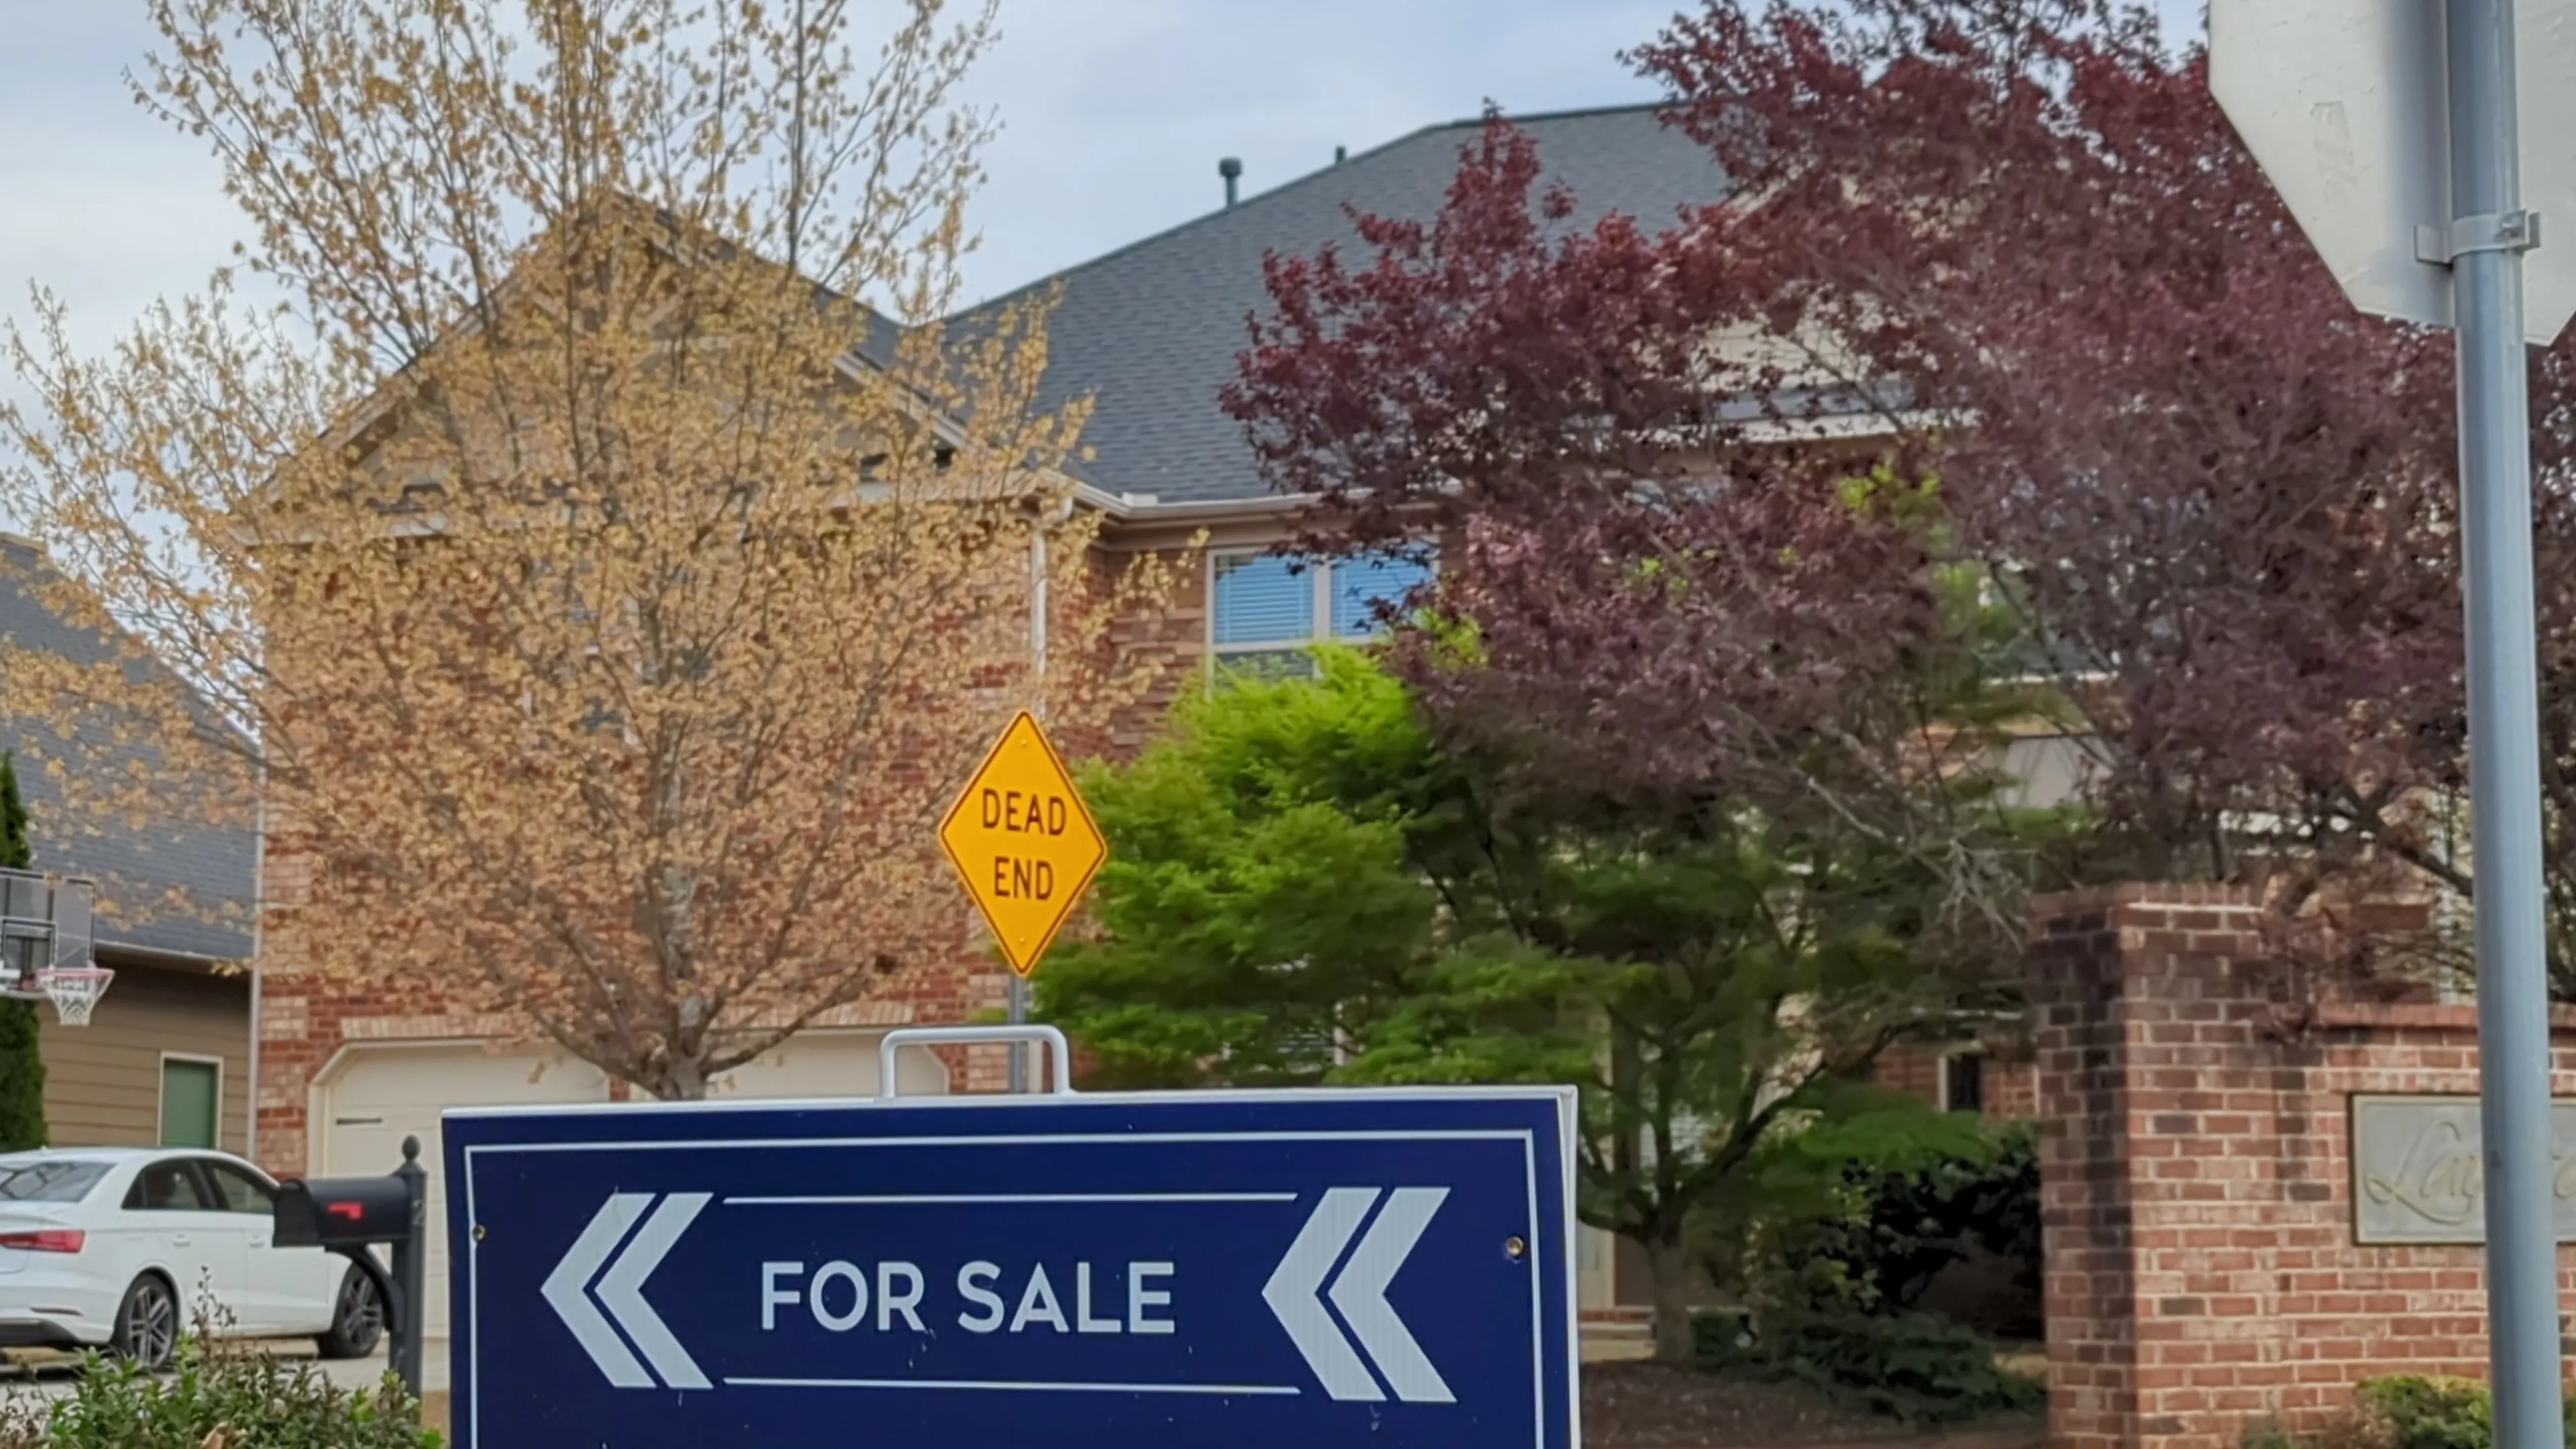
Watch the video, then read on for what the listings and the county records say.
Existing-home sales fell to a seasonally adjusted annual rate of 3.75 million in October 2026. That is the lowest pace since August 2010, according to the National Association of Realtors. The report came out November 12, 2026.
Most coverage of this report stopped at the headline. The regional data, the affordability numbers, and a longer look back make the picture considerably worse than “lowest since 2010” on its own suggests.
The chart that didn’t run anywhere else
Every outlet covering this report compared October 2026 to 2010. Almost none compared it to the sales boom that came before 2010. That comparison is the one that actually shows how far the market has fallen.
The 2005 peak was 7.08 million homes a year. The 2010 trough, widely treated as the bottom of the crash, was 4.92 million. Today’s pace is 3.75 million. The market has not just returned to crisis-era lows. It has gone below them.
What actually happened in October
Sales fell 5.5% from September and 8.8% from a year earlier. Mortgage rates are the main reason. Rates climbed to their highest level since 2000, aside from a single month in 2023, according to NAR chief economist Lawrence Yun.
The timing lines up with a specific spike. Sean Fergus of NewHomeSource and Zonda pointed to buyers who stepped back when rates hit 7.4% in mid-October. That is not an abstract affordability trend. It is an identifiable group of buyers who paused at a specific number.
Selma Hepp, chief economist at Cotality, put it plainly: “Housing affordability remains a major constraint.” She does not expect that to change quickly. “Until then, I expect activity to remain relatively subdued,” she said.
The regional breakdown nobody led with
National averages hide which parts of the country are actually driving the decline. The West is driving it.
The West fell 9.7% from September alone and 14.5% from a year earlier, the steepest drop of any region. The Northeast, by contrast, held roughly flat month over month and posted the smallest annual decline at 4.1%.
Regional median prices tell a related story. The West’s median existing-home price was $624,300, more than double the Midwest’s $324,300. Higher-priced regions appear to be absorbing more of the rate shock, which tracks with basic affordability math: a rate increase costs more in dollar terms on a $600,000 loan than a $300,000 one.
The numbers underneath the headline sales figure
A few data points from the same report explain why this slowdown is different from a simple inventory shortage.
First-time buyers are retreating. Their share of sales fell to 29%, down from 31% in September and 32% a year earlier. This group is typically the most rate-sensitive, since they have no existing equity to offset a higher payment.
Cash buyers are picking up the slack. All-cash purchases rose to 29% of sales, up from 27% in September. When cash buyers gain share while first-time buyers lose it, the market is shifting toward buyers who don’t need financing, not toward more total buyers.
Homes are sitting longer. Median days on market rose to 35, up from 33 in September and 34 a year earlier. That is a small move, but it is moving the wrong direction for sellers.
Inventory is up, but barely. There are 1.59 million homes for sale, up 4.6% from a year ago and the most for any October since 2019. At the current sales pace, that works out to 5.1 months of supply. A balanced market is usually considered 5 to 6 months, so supply is approaching balance largely because sales have collapsed, not because listings have surged.
Prices are still rising, barely. The median existing-home price was $416,700, up 0.4% year-over-year. That extends a 40-month streak of annual price gains, the longest stretch NAR has recorded. Prices have not cracked even as sales volume has.
Affordability fell everywhere, but not evenly
NAR’s housing affordability index dropped to 100.7 from 107.3 a year earlier. Every region posted a decline, but the size of the drop varied sharply.
The Northeast’s affordability fell the most, down 8.7% year-over-year. The West’s affordability fell the least, down 5.2%, likely because West Coast affordability was already so stretched that there was less room left to fall.
Why 2010 is the wrong comparison
Every headline on this report, including Forbes’s, framed the drop as “lowest since 2010.” That comparison implies today’s market resembles the aftermath of a housing crash. It does not, in one important way: there is no foreclosure wave behind this slowdown.
Distressed sales, the combination of foreclosures and short sales, held at just 2% of all transactions in October, flat from both September and a year earlier. In 2010, distressed sales ran far higher, often above 30% of the market in the hardest-hit periods. The mechanism is completely different. 2010’s low sales volume came from forced selling and buyer fear after a credit collapse. 2026’s low volume comes from buyers who are financially fine but priced out by the combination of mortgage rates and home prices.
Yun’s own framing supports this. He called it a sales drought, not a collapse, and pointed to roughly 88 million homeowners who are largely in a comfortable financial position. Nobody said anything like that in 2010.
What would actually change this
Yun said there could be sizable pent-up demand if mortgage rates decline. That is the single variable everyone covering this story points to. Nothing else in the report suggests a second lever.
For a buyer or seller trying to read this moment: the slowdown is a rate story, not a supply story and not a credit story. Inventory is already near a seven-year high for this time of year. Prices have not fallen. The constraint is the monthly payment, and the monthly payment is a function of the 30-year rate, which is sitting at levels not seen since 2000 outside of one month in 2023. Our mortgage calculator runs the actual math on a specific price and rate, rather than leaving the payment as an abstraction.
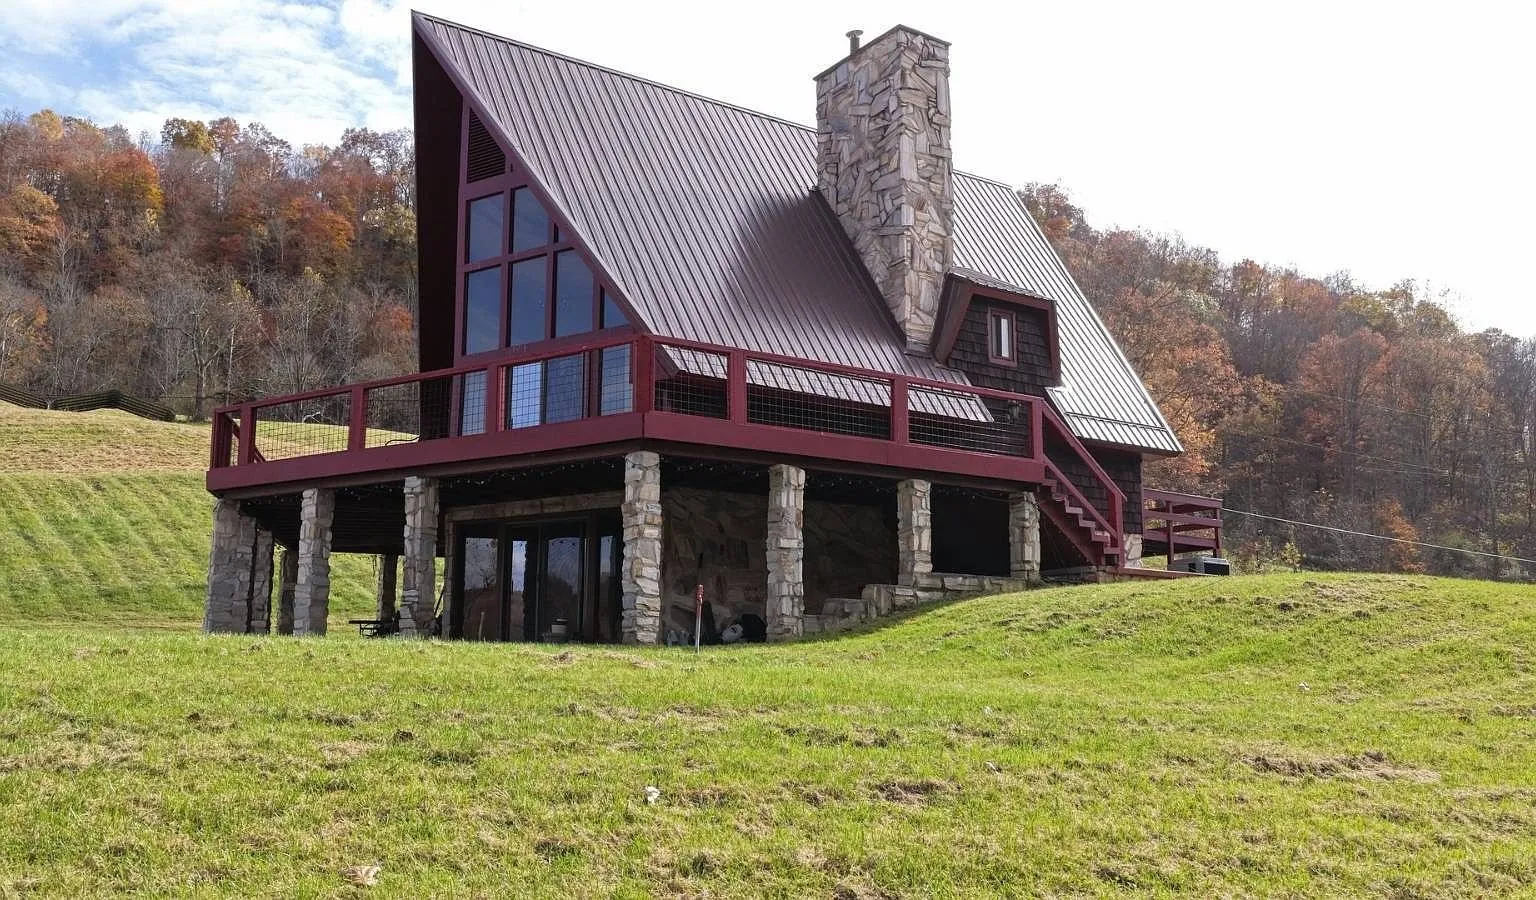
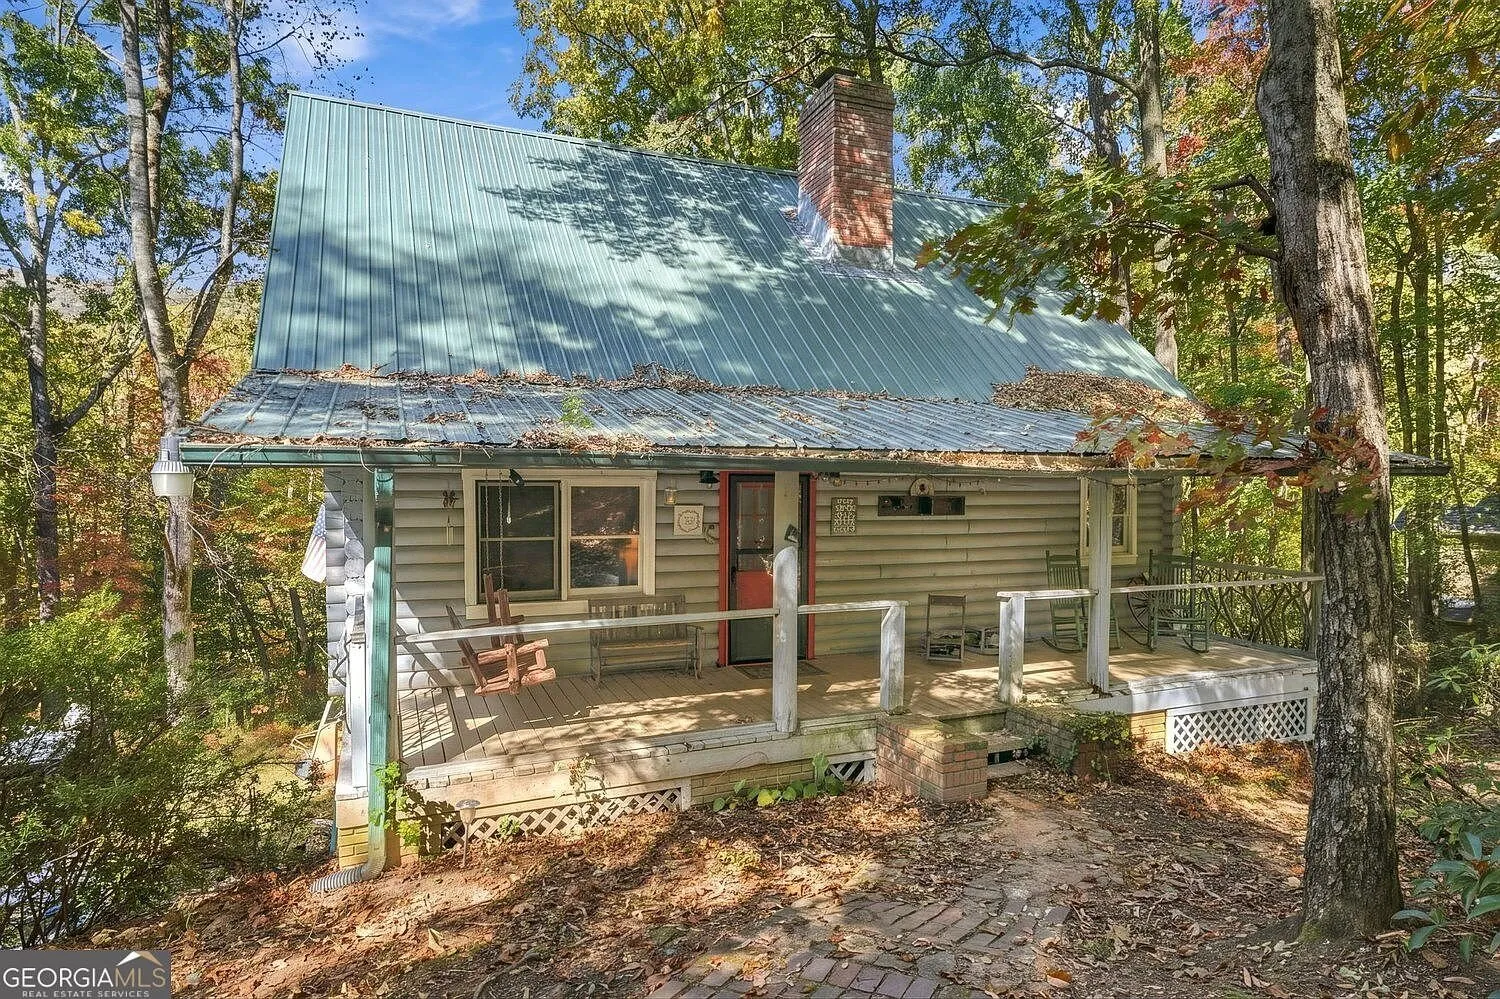
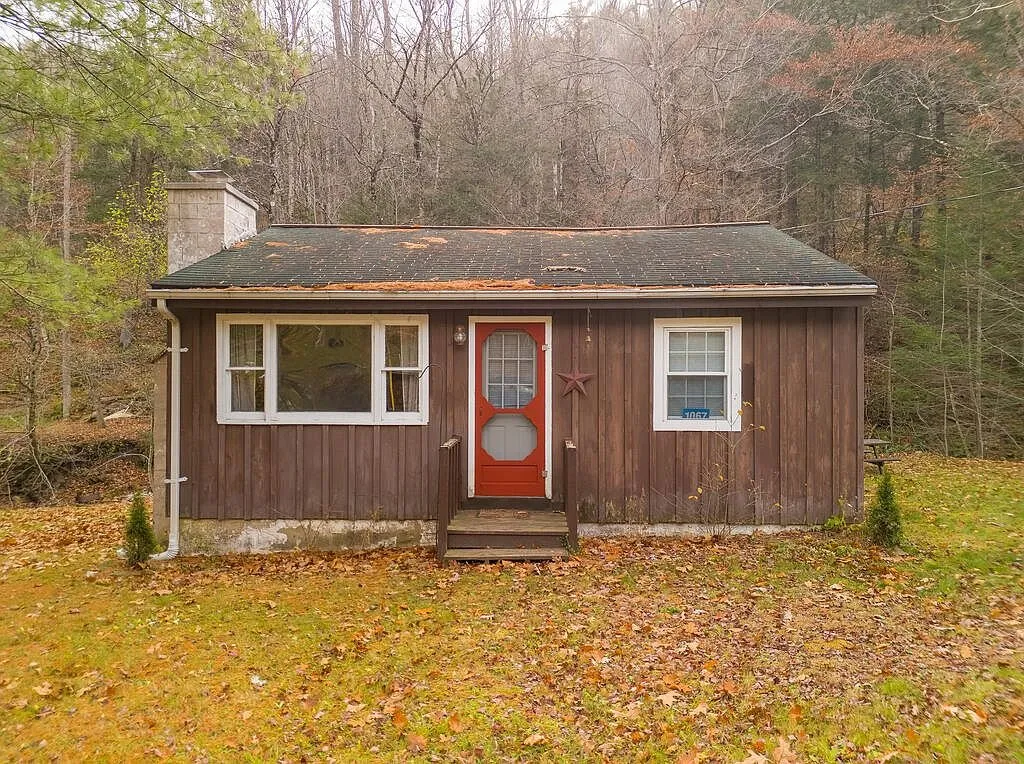
If a buyer needs to move now and can absorb today’s rate on a specific property, the numbers in this report point toward selection and softer negotiating leverage: longer days on market, more cash competition but fewer total bidders, and a seller pool that is not yet cutting prices. That is exactly the kind of lower-priced, rural and small-town inventory this national pressure has not hit as hard as it has hit the high-cost West: a mid-century home on 14 acres near Seymour, Tennessee at $599,000, a log cabin with deeded river access in Walland, Tennessee at $399,000, and two reconstructed antique log cabins bordering Cherokee National Forest at $370,000. The full current lineup covers more of the same.
Frequently asked questions
What was the exact existing-home sales rate for October 2026? 3.75 million homes, seasonally adjusted annual rate, according to NAR’s November 12, 2026 release. That was down 5.5% from September and 8.8% from October 2025.
Is this actually the lowest sales level since 2010, or since some other year? Since August 2010, per NAR chief economist Lawrence Yun’s own statement. Some early wire coverage mislabeled this as “since 2016,” but the original NAR data and the bulk of subsequent reporting confirm 2010.
How does this compare to the 2005 housing boom? 2005’s peak was 7.08 million annual sales. October 2026’s pace of 3.75 million is about 47% below that peak, and is also below the 4.92 million trough recorded in 2010.
Is this a repeat of the 2008 housing crash? No, on the data available. Distressed sales (foreclosures and short sales) were 2% of transactions in October 2026, versus often more than 30% during the worst of the 2008-2010 crisis. This slowdown is driven by mortgage rates and affordability, not a wave of forced selling.
Which region is seeing the biggest sales decline? The West, down 14.5% year-over-year and 9.7% month-over-month, the steepest drop nationally. The Northeast posted the smallest annual decline, at 4.1%.
What would reverse the slowdown? A meaningful drop in mortgage rates, according to Yun, who said there could be sizable pent-up demand if rates decline. No other factor in the October report points toward a near-term turnaround.
The email
We find the affordable end of this market: homes, land, and acreage listed well under the national median. The best of it goes out by email as we find it.